e-nventory
A B2B/E-Commerce Saas web platform that provides cloud-based inventory management solutions.
Services:
UX/UI Design
Web Design

Challenge
Effective inventory system is vital but challenging for retail stores. E-nventory aims to streamline this, but the current dashboard lacks customization and doesn't fully meet user needs.
My Role
UX/UI Designers
Process
Discovery
Design
Prototype
Tools
Figma
Loom
Zoom
Google Suite
Solution
Perform user interviews to form user personas, understanding their requirements, desires, and pain points. Utilize this insight to conceptualize a dashboard solution that simplifies inventory management, particularly targeting users new to the process.

1
Discovery

Interviews
The interviews were administered to people who work in the warehouse management industry. I went through these interviews to gather any additional insights and to get a better feel for what pains and gains are.
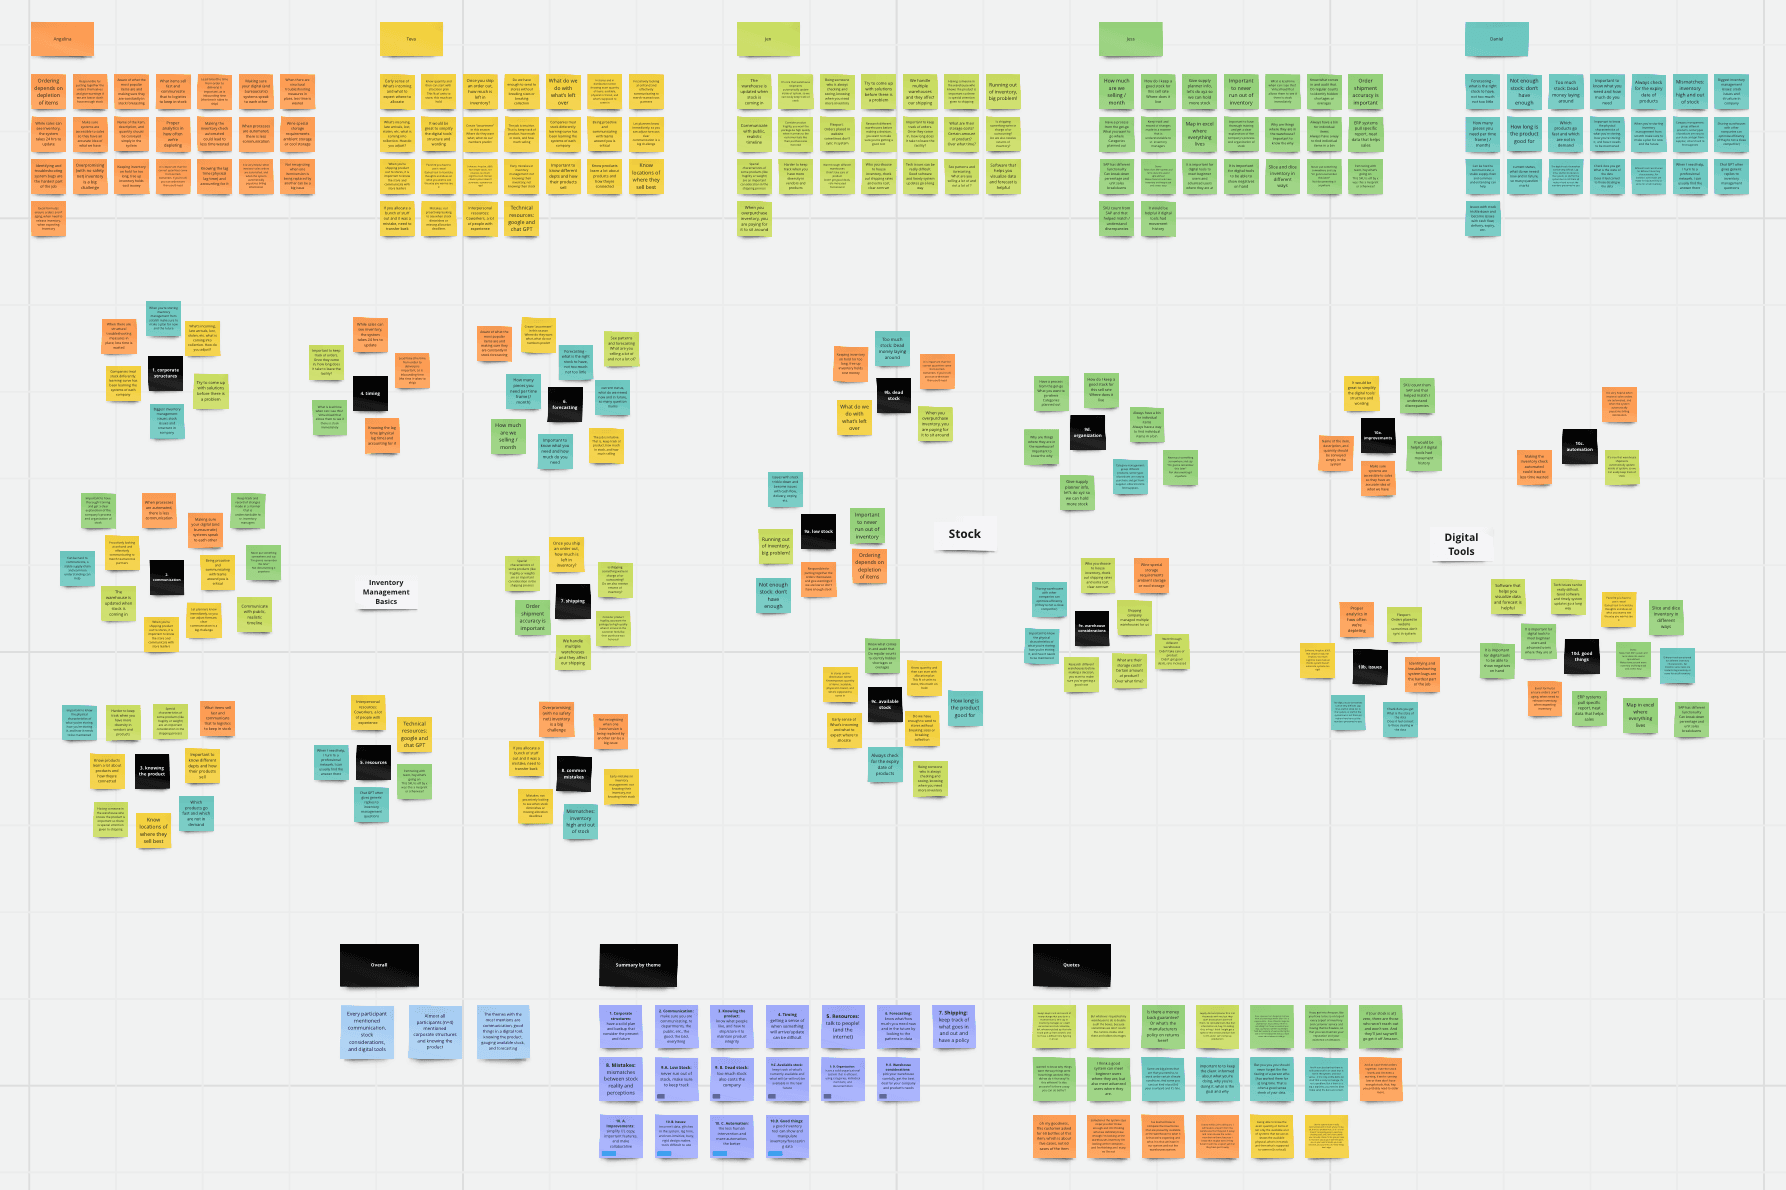
Affinity Mapping
Here I reviewed all the content that was gathered by the research team. Some key concepts are corporate structures, communication, knowing the product, timing, forecasting, shipping, common mistakes, low stock, available stock, dead stock, automation, and organization.

Empathy Mapping
The research team's empathy maps reveal users' environmental perceptions, highlighting their pains, gains, and thoughts. ‘Starting Anew Selah’ and ‘Experienced Evie’ have distinctly different needs in their roles.
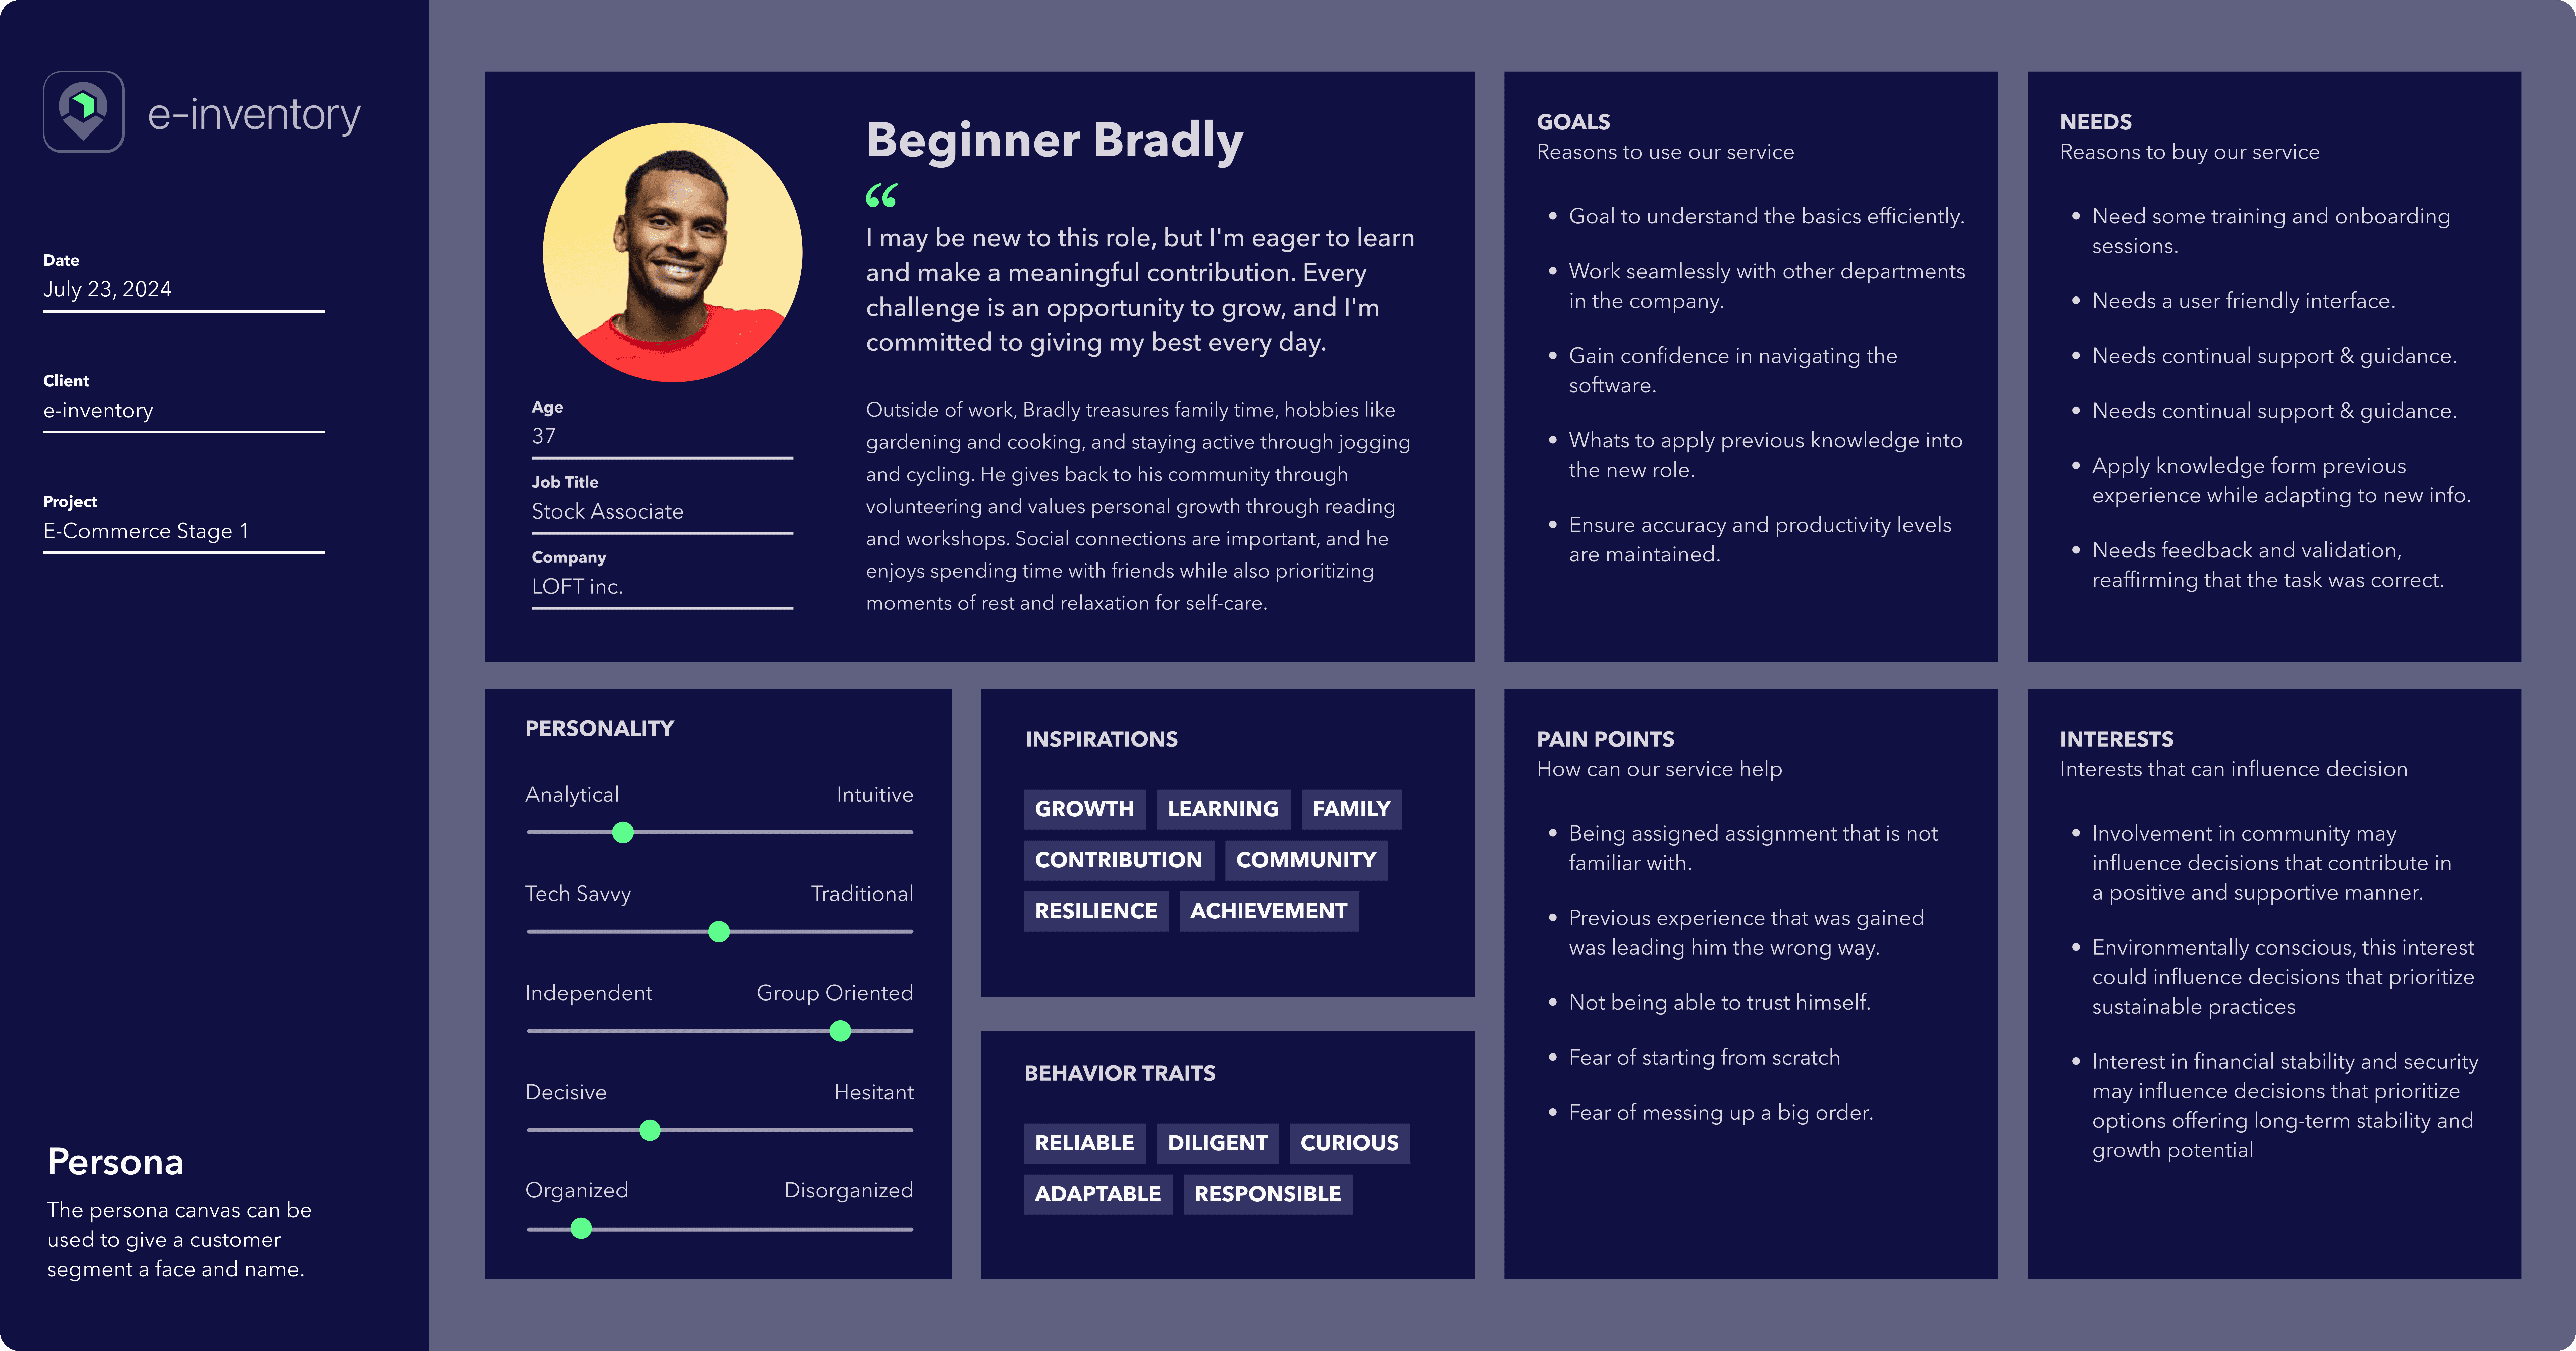
Personas
Below are the Personas I developed based on the User Interviews, Affinity Map, and Empathy Maps. In these personas, both Beginner Bradly and Experienced Evie have distinct needs in the software update. Bradly, being new to leadership roles and software requires assistance with onboarding and error prevention. Meanwhile, Evie, with her experience, seeks support in predicting and addressing supply chain issues. Despite their differing levels of experience, both share the common goal of enhancing warehouse operations through software updates, though with different areas of emphasis.

HMW & POV Statements
How Might We (HMW) and Point of View (POV) statements are great launching points for brainstorming the needs of the people we are conceptualizing by defining strategic questions and scenarios. These questions and statements help hone in on what was needed and why.
The statements that I’m focusing on in this project is:
#5 - From a new trainee to a seasoned manager, when it comes to incorporating data there is room for human error because of this the process can be messed up and the data can be off. How might we avoid & safeguard stocking mistakes?

Old UI's
Here are the designs that were handed over at the beginning of the project. These are the warehouse inventory dashboard and inventory screens.

2
Ideation

Crazy 8 Method
With this brainstorming session, I took some of the HMW questions and visualized them with sketching. Did a brain dump of all the possible visualizations. This helped to get in the mindset of what is needed in the application that targets the user’s needs.
Roadmap Sketch
This larger sketch is the general direction I wanted to move forward with after the crazy 8's sketch session. Through the research phase, I found that it's most important to forecast and predict inventory needs, and assistance for newcomers would greatly help avoid and safeguard stocking mistakes.

3
Design
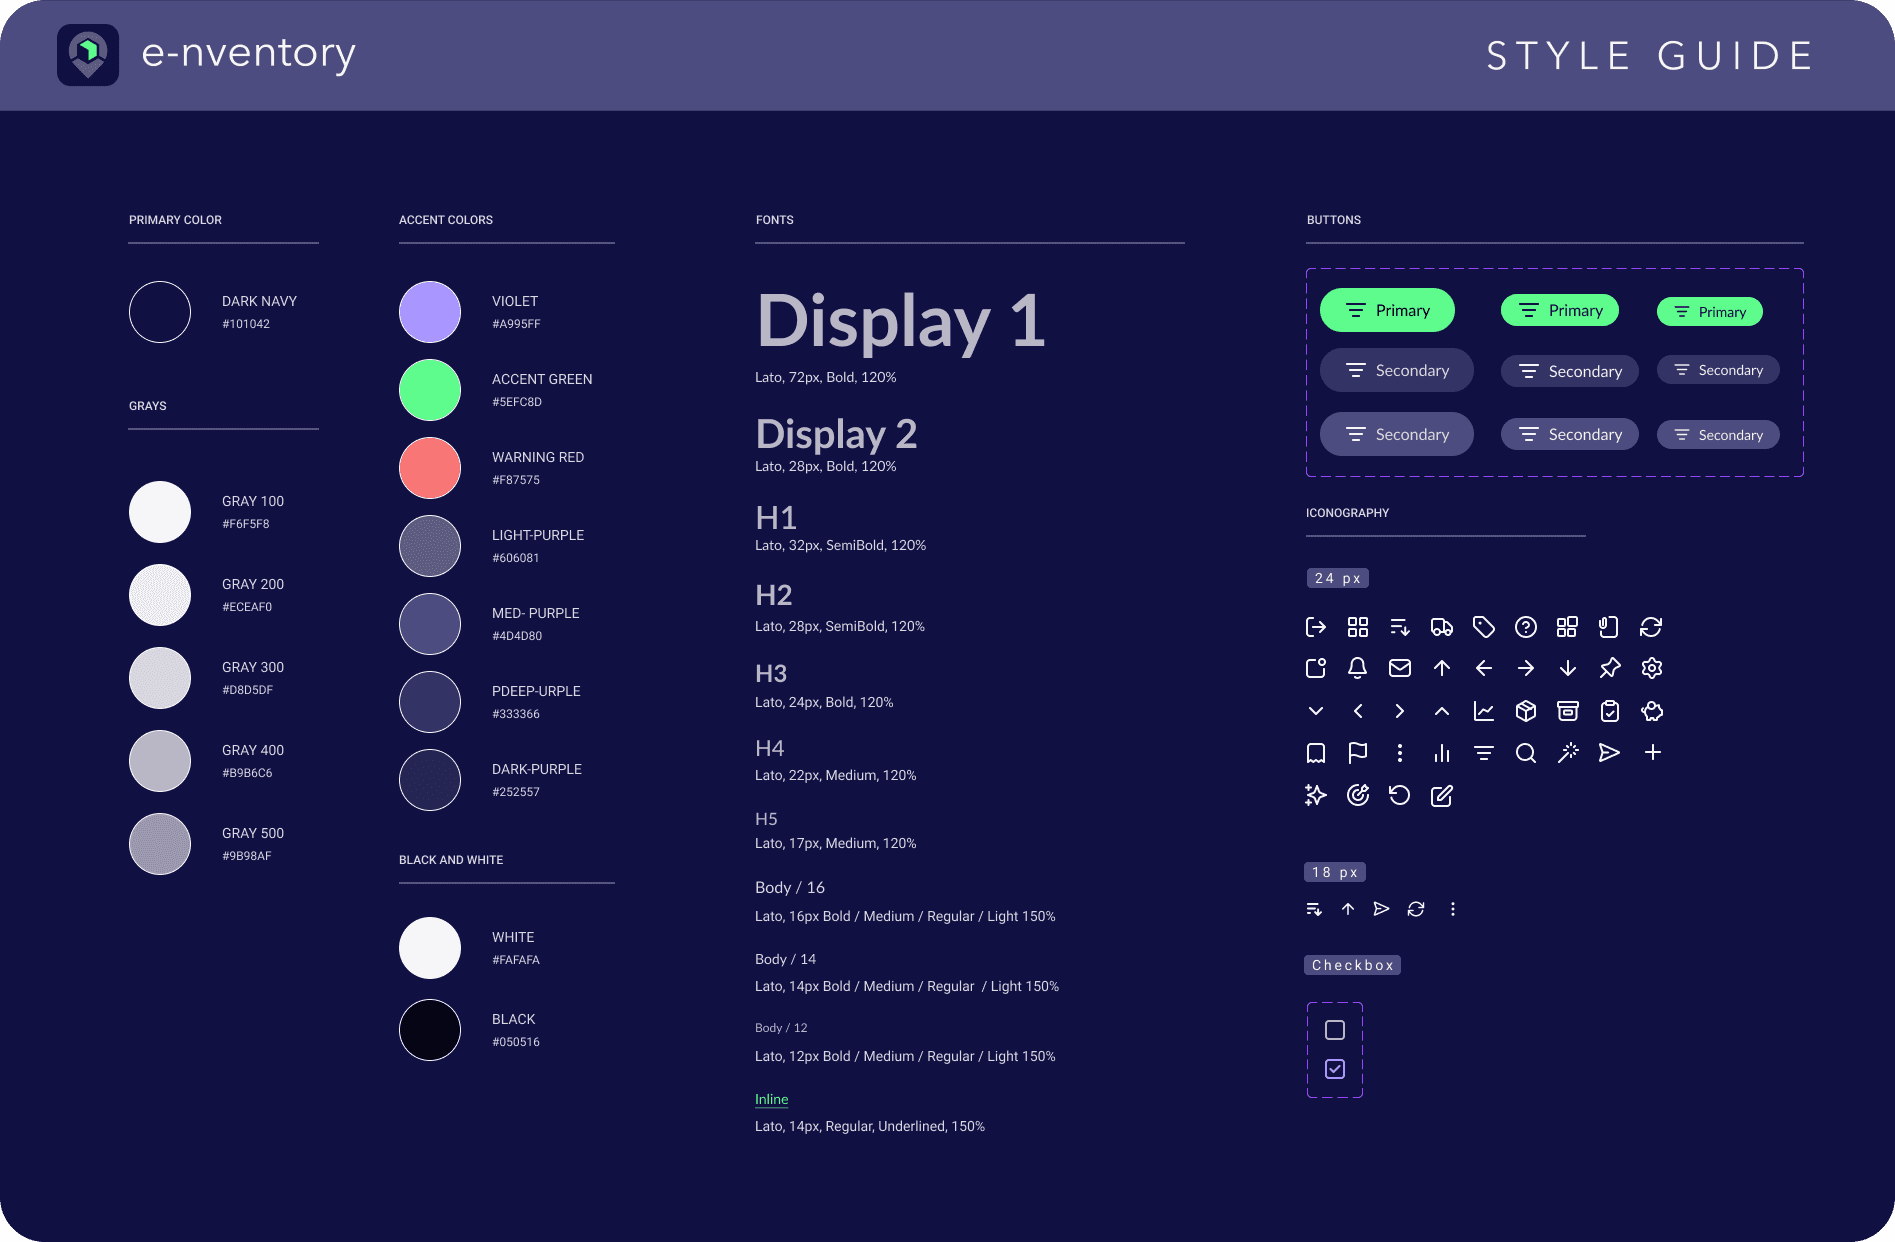
Style Guide
e-nventory has a dark screen mode on the platform. The main typeface is Lato and the main color scheme is dark navy with a bright cool-toned green as the main accent color.
Components
Numerous inconsistencies stem from the absence of diverse components and variants. I took the initiative to design a multitude of elements: from icon and text variants to header, footer, navigation bar, and chatbot components, fostering both enhanced consistency and effortless adaptability in the layout.

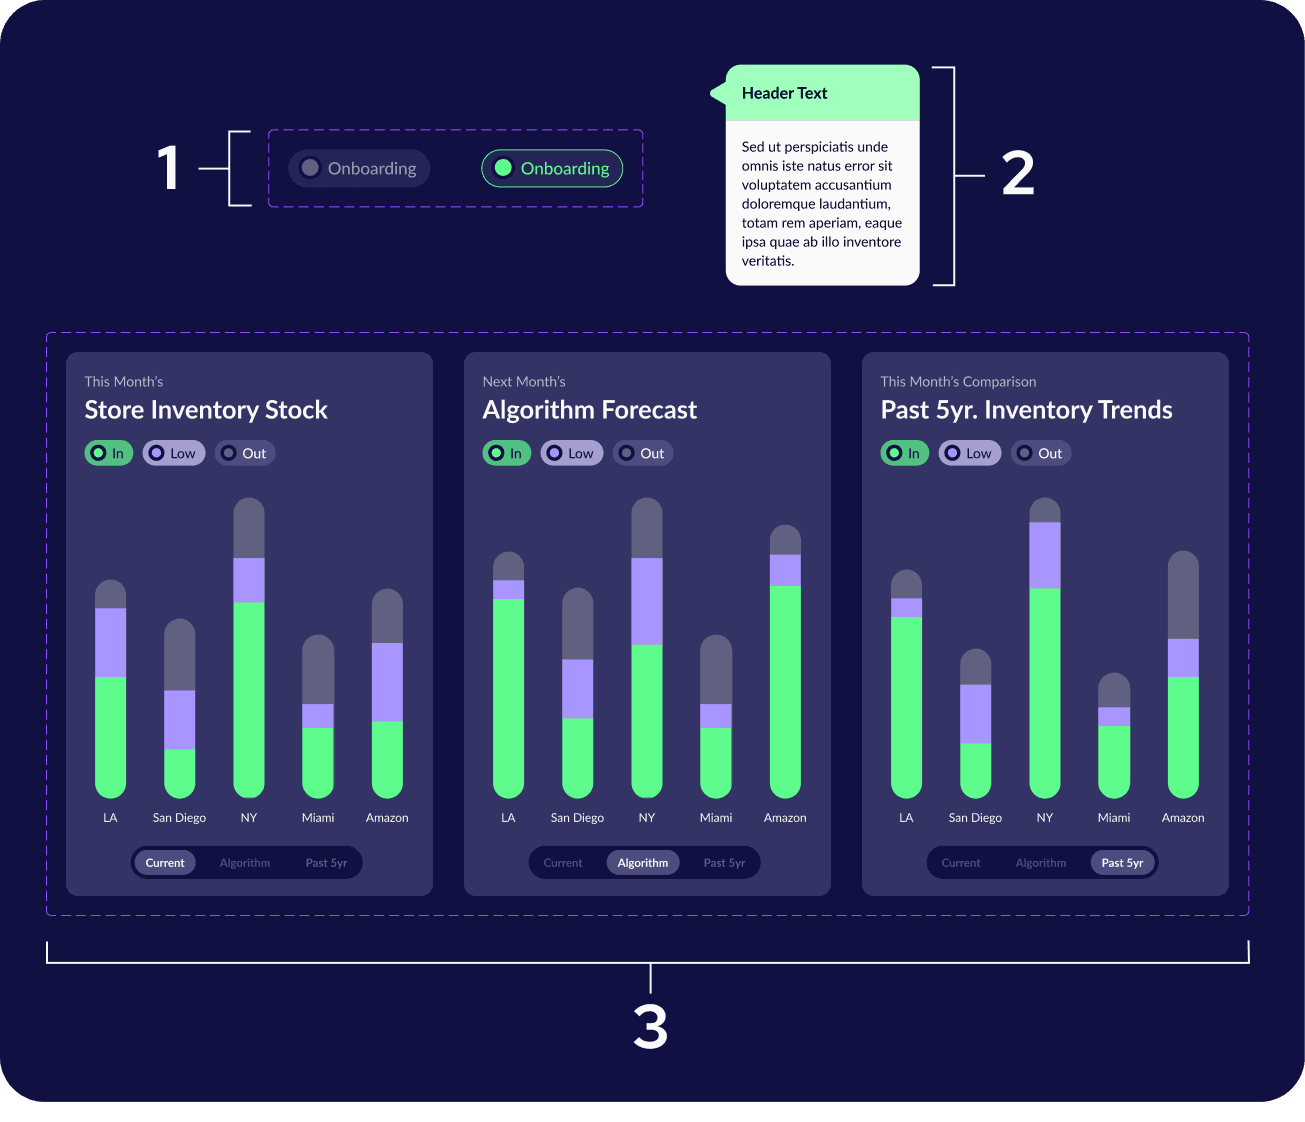
New Components
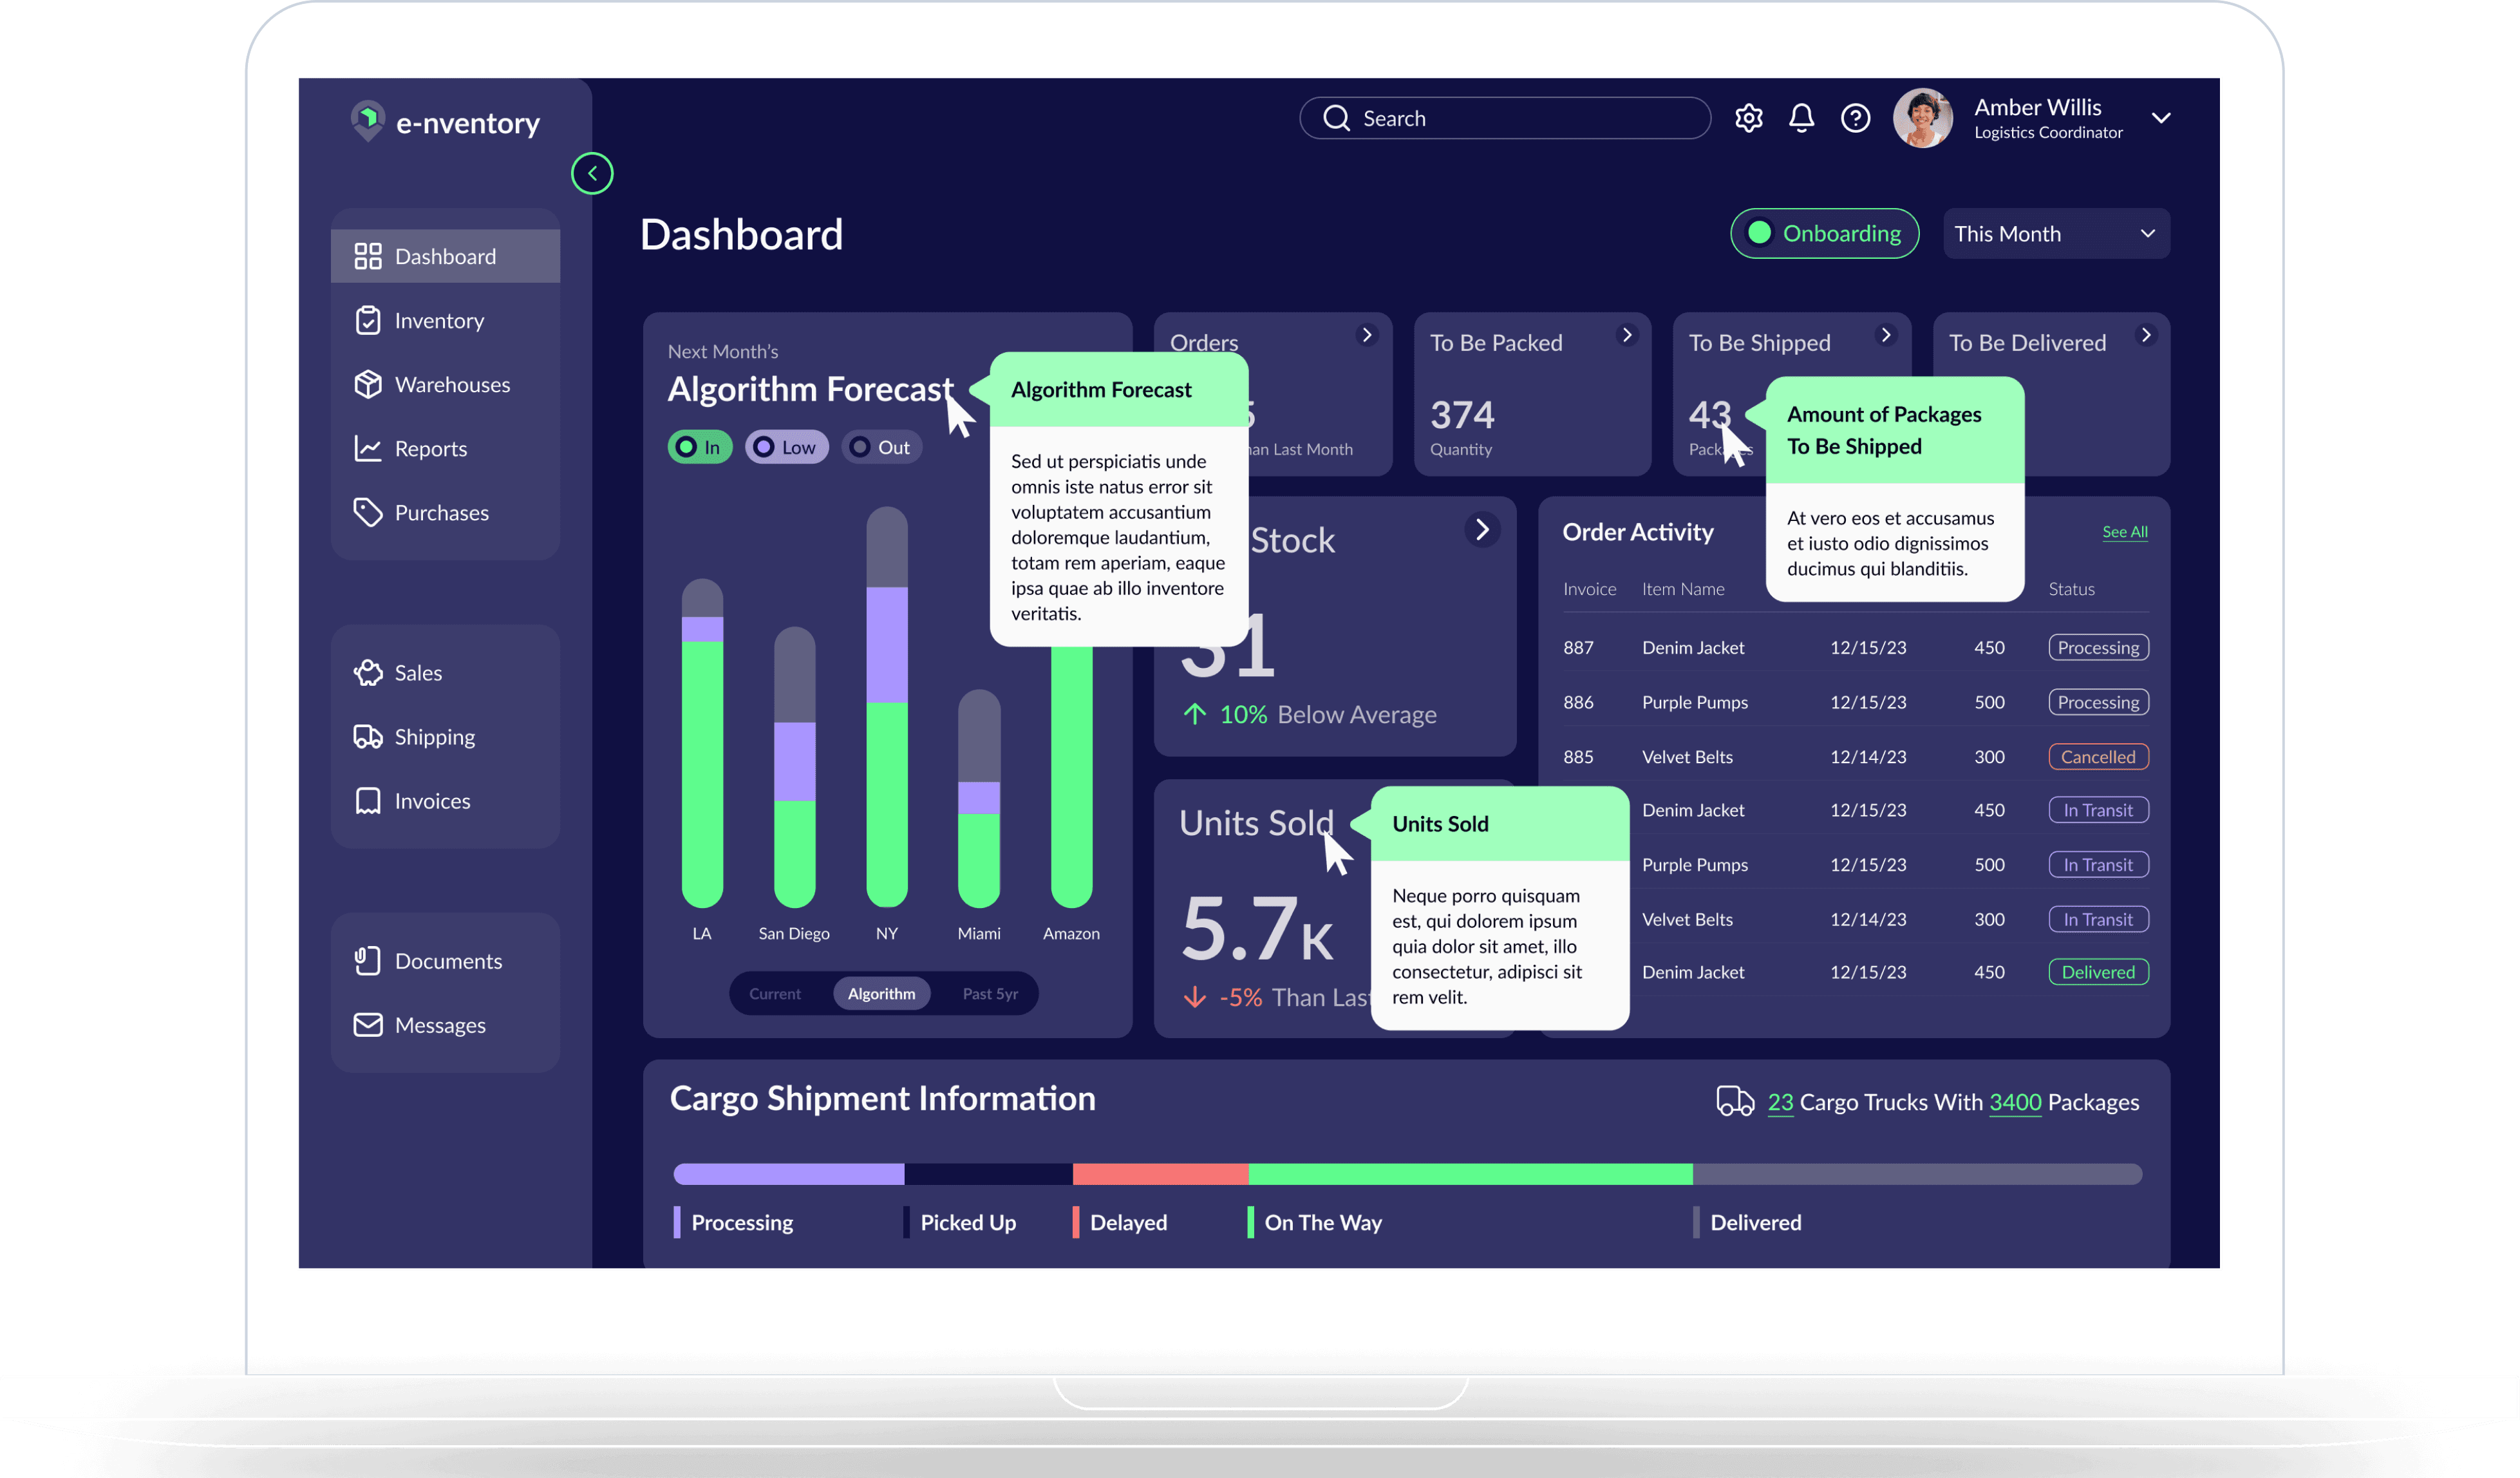
Here are the components that were designed in response to the research and ideation that was conducted. All three of these updates main goal is to reduce mistakes.
1. Onboarding Button: This button was created to help people who are new to the software. By selecting the ‘Onboarding’ button the user can click on any element and get helpful information that is more robust than tooltip popups.
2. Information Popover: Instead of having a small amount of information on a tooltip popup, the Popover was chosen because it can hold more in-depth information and can be more customized to content needs. This content is designed to help new users understand the array of complicated information and functions.
3. Store Inventory Forecast: This card is designed to help the user better predict supply needs. The toggle buttons switch between Current (Store Inventory Stock), Algorithm (Algorithm Forecast), and Past 5yr. (Past 5yr. Inventory Trends) charts.
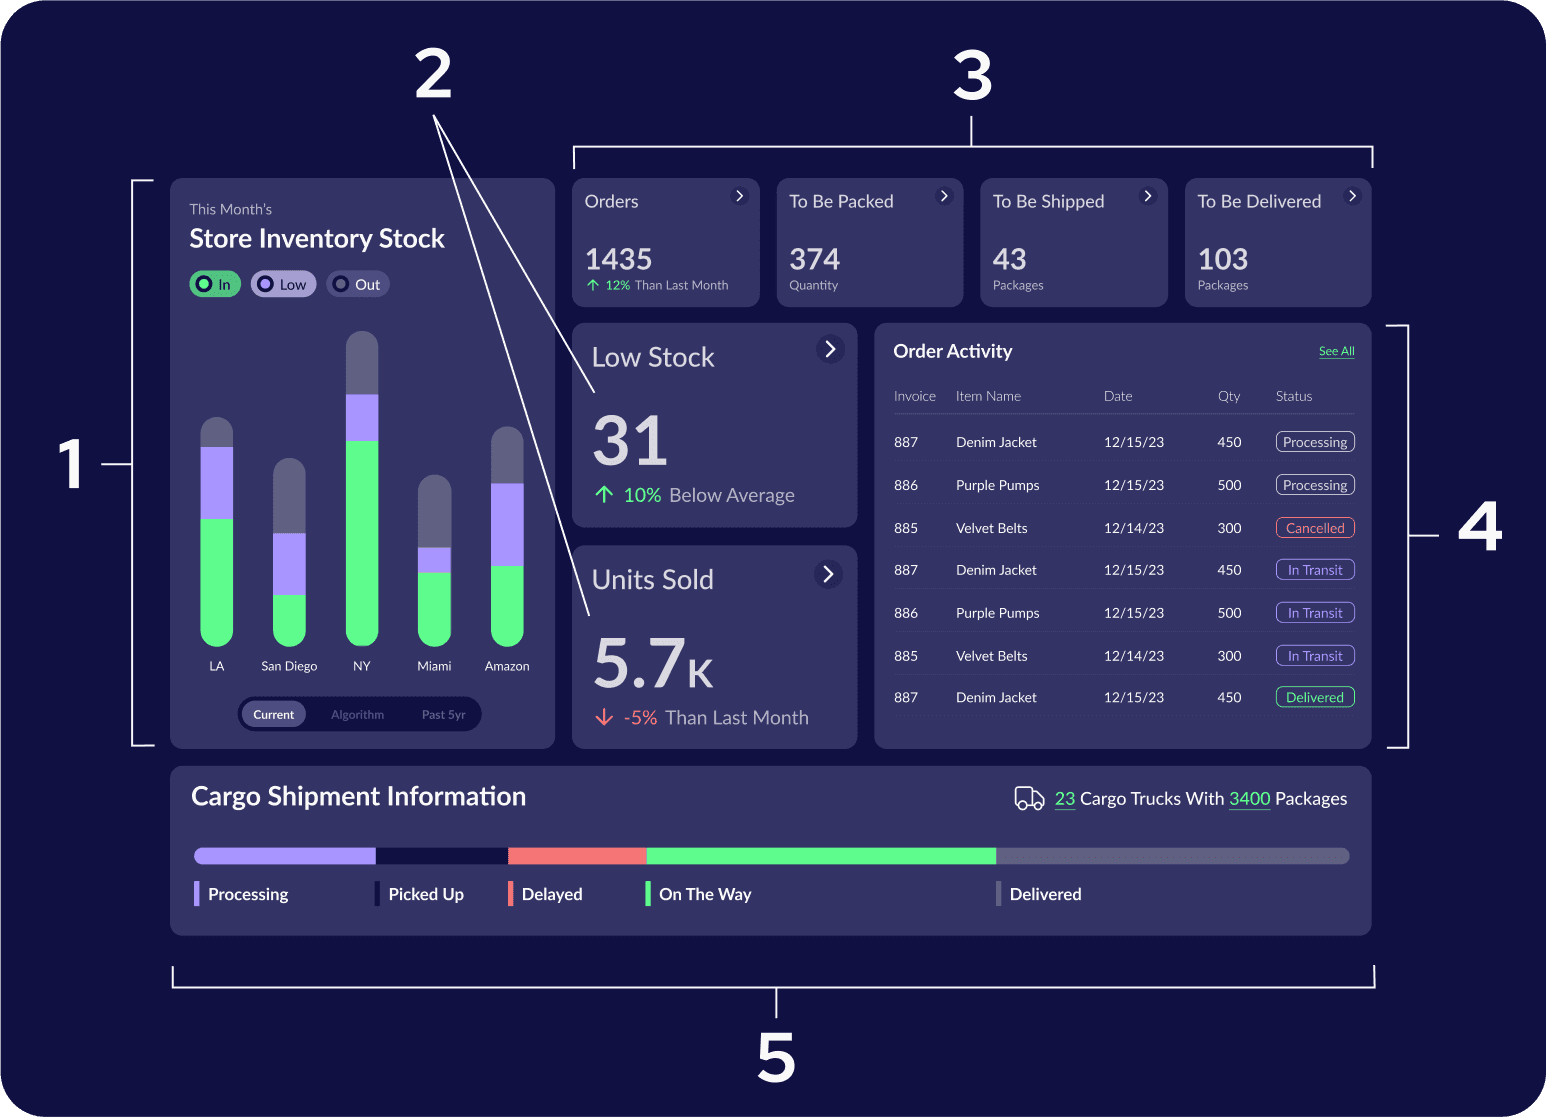
Hierarchical Changes
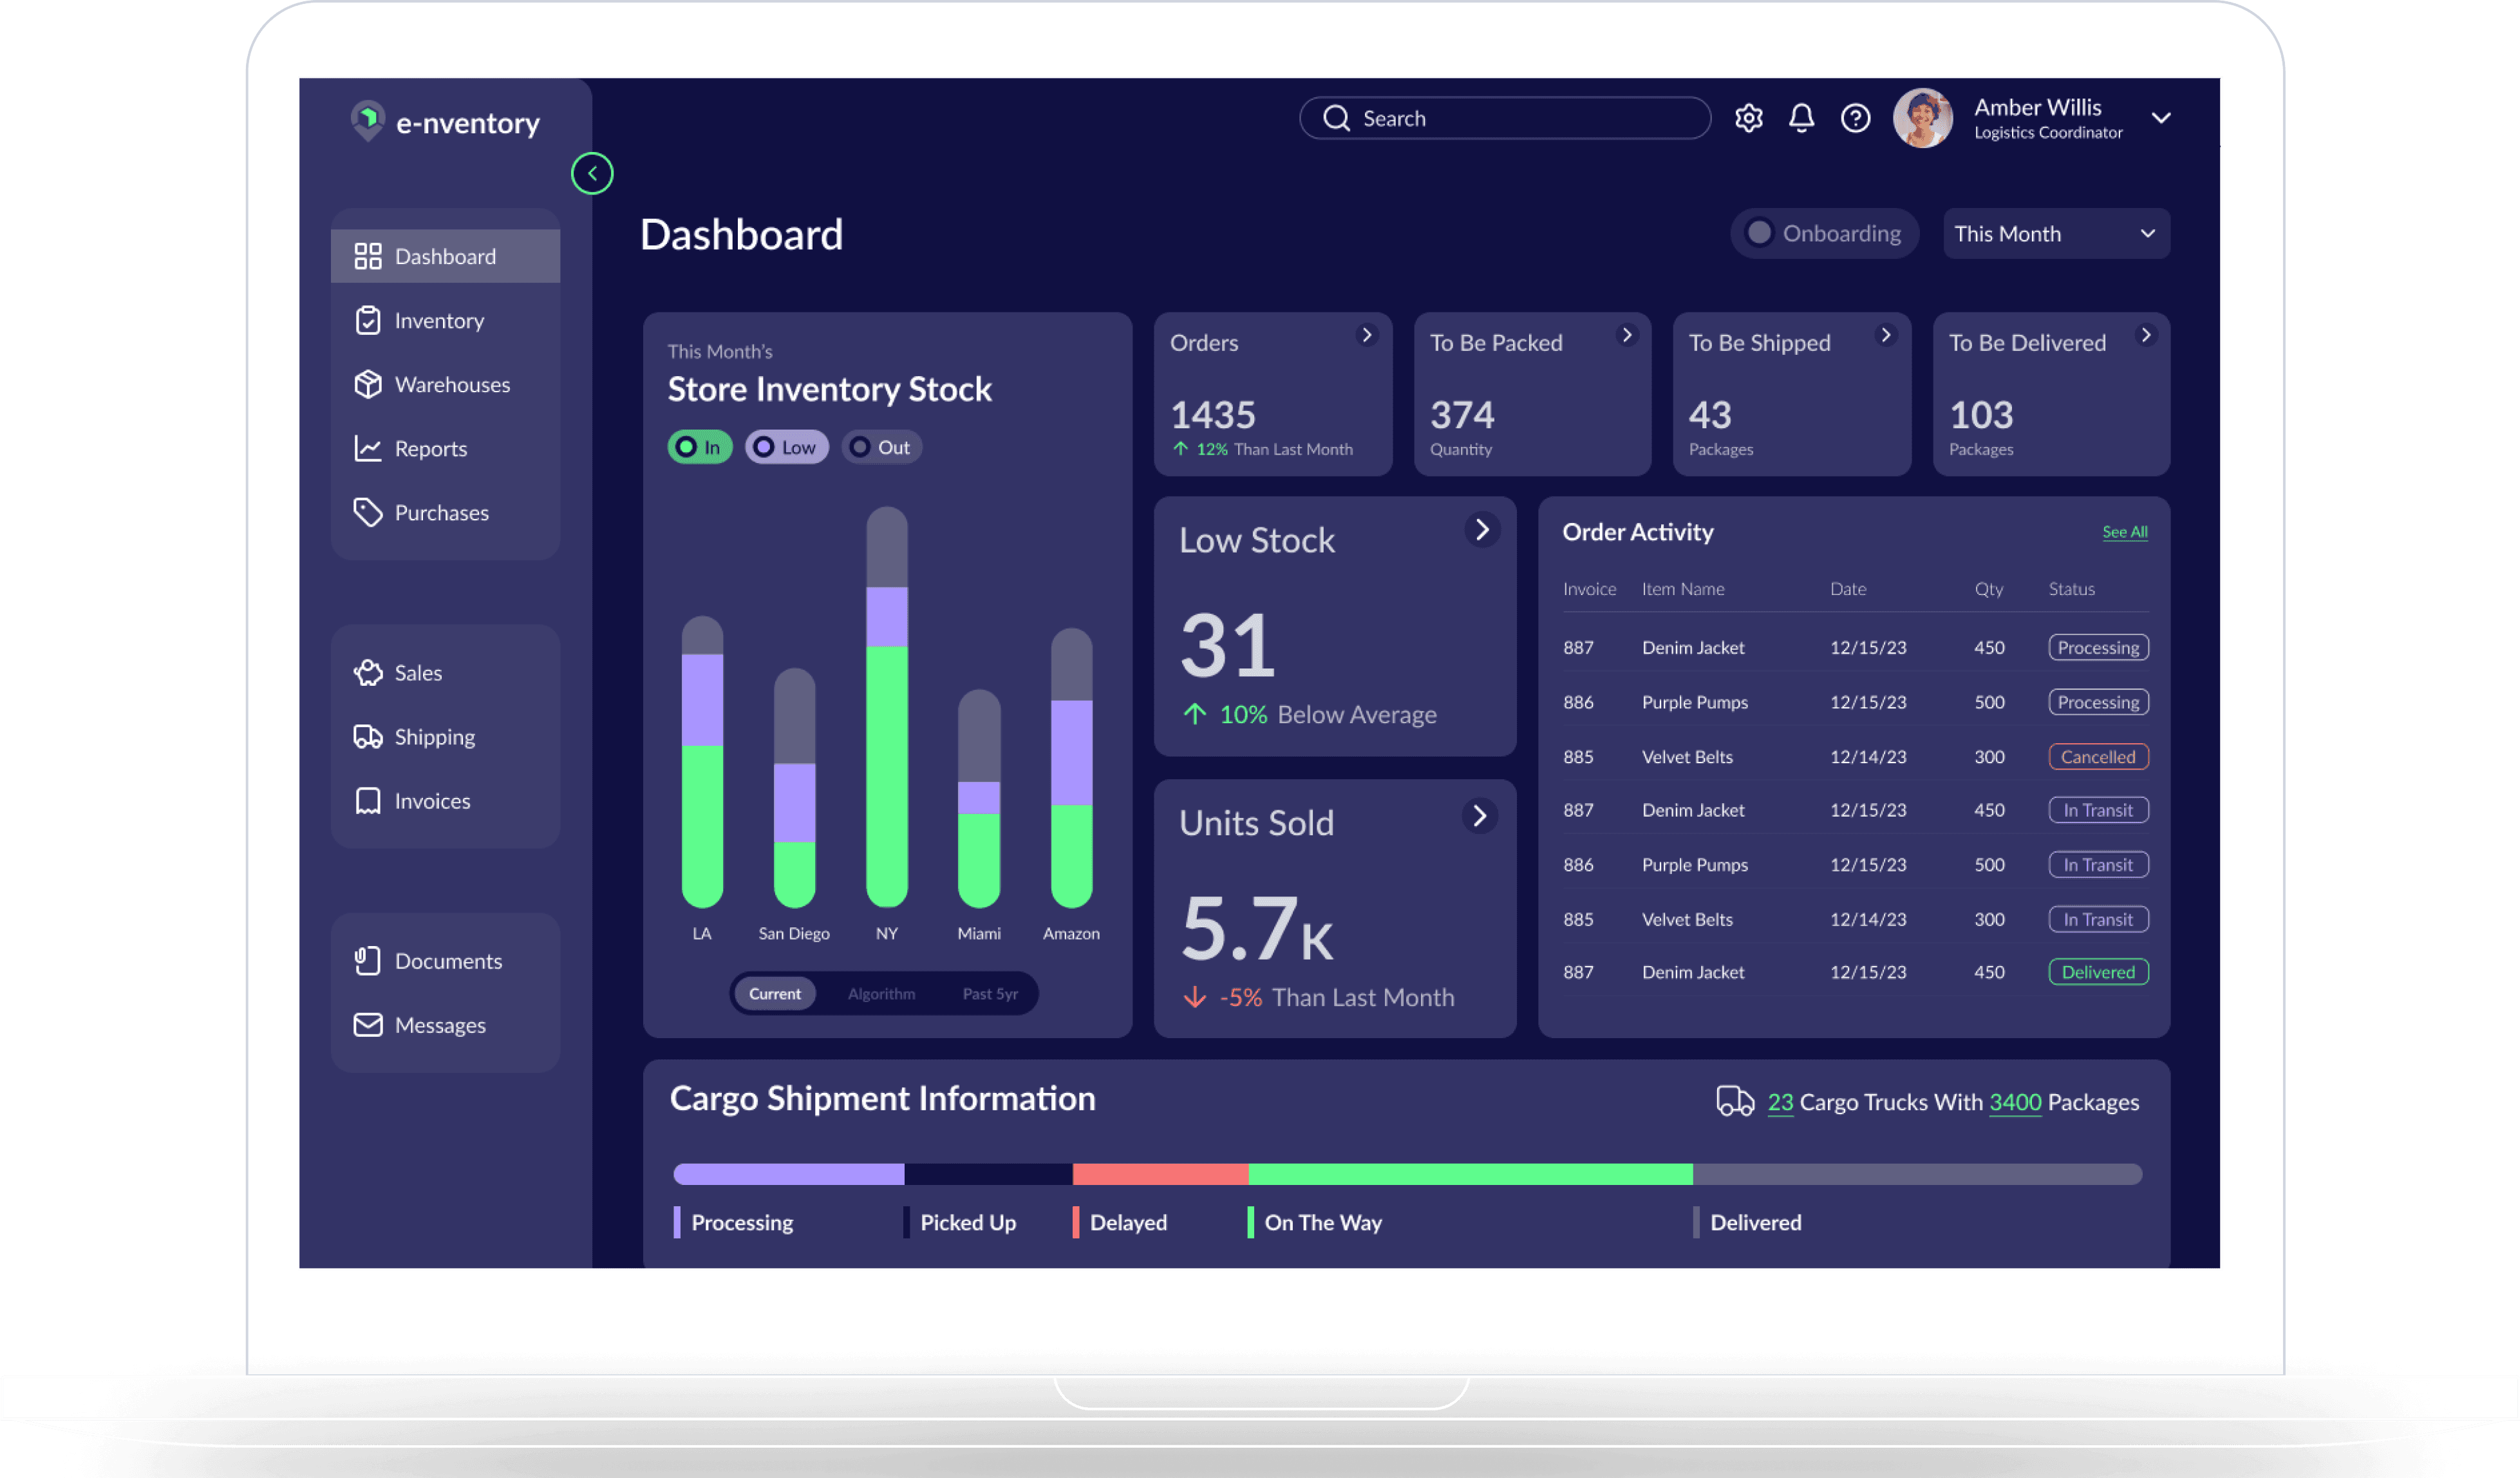
I arranged the screen hierarchy to prioritize important forecasting data, making it easier for users to quickly understand key information.
Store Inventory Stock is the most prominent element for effective warehouse management, naturally drawing the eye to the top left.
Low Stock and Units Sold are key forecasting metrics placed near the bar chart, with larger cards for better visibility.
Order Process Cards are grouped by process steps, emphasizing the order in the information.
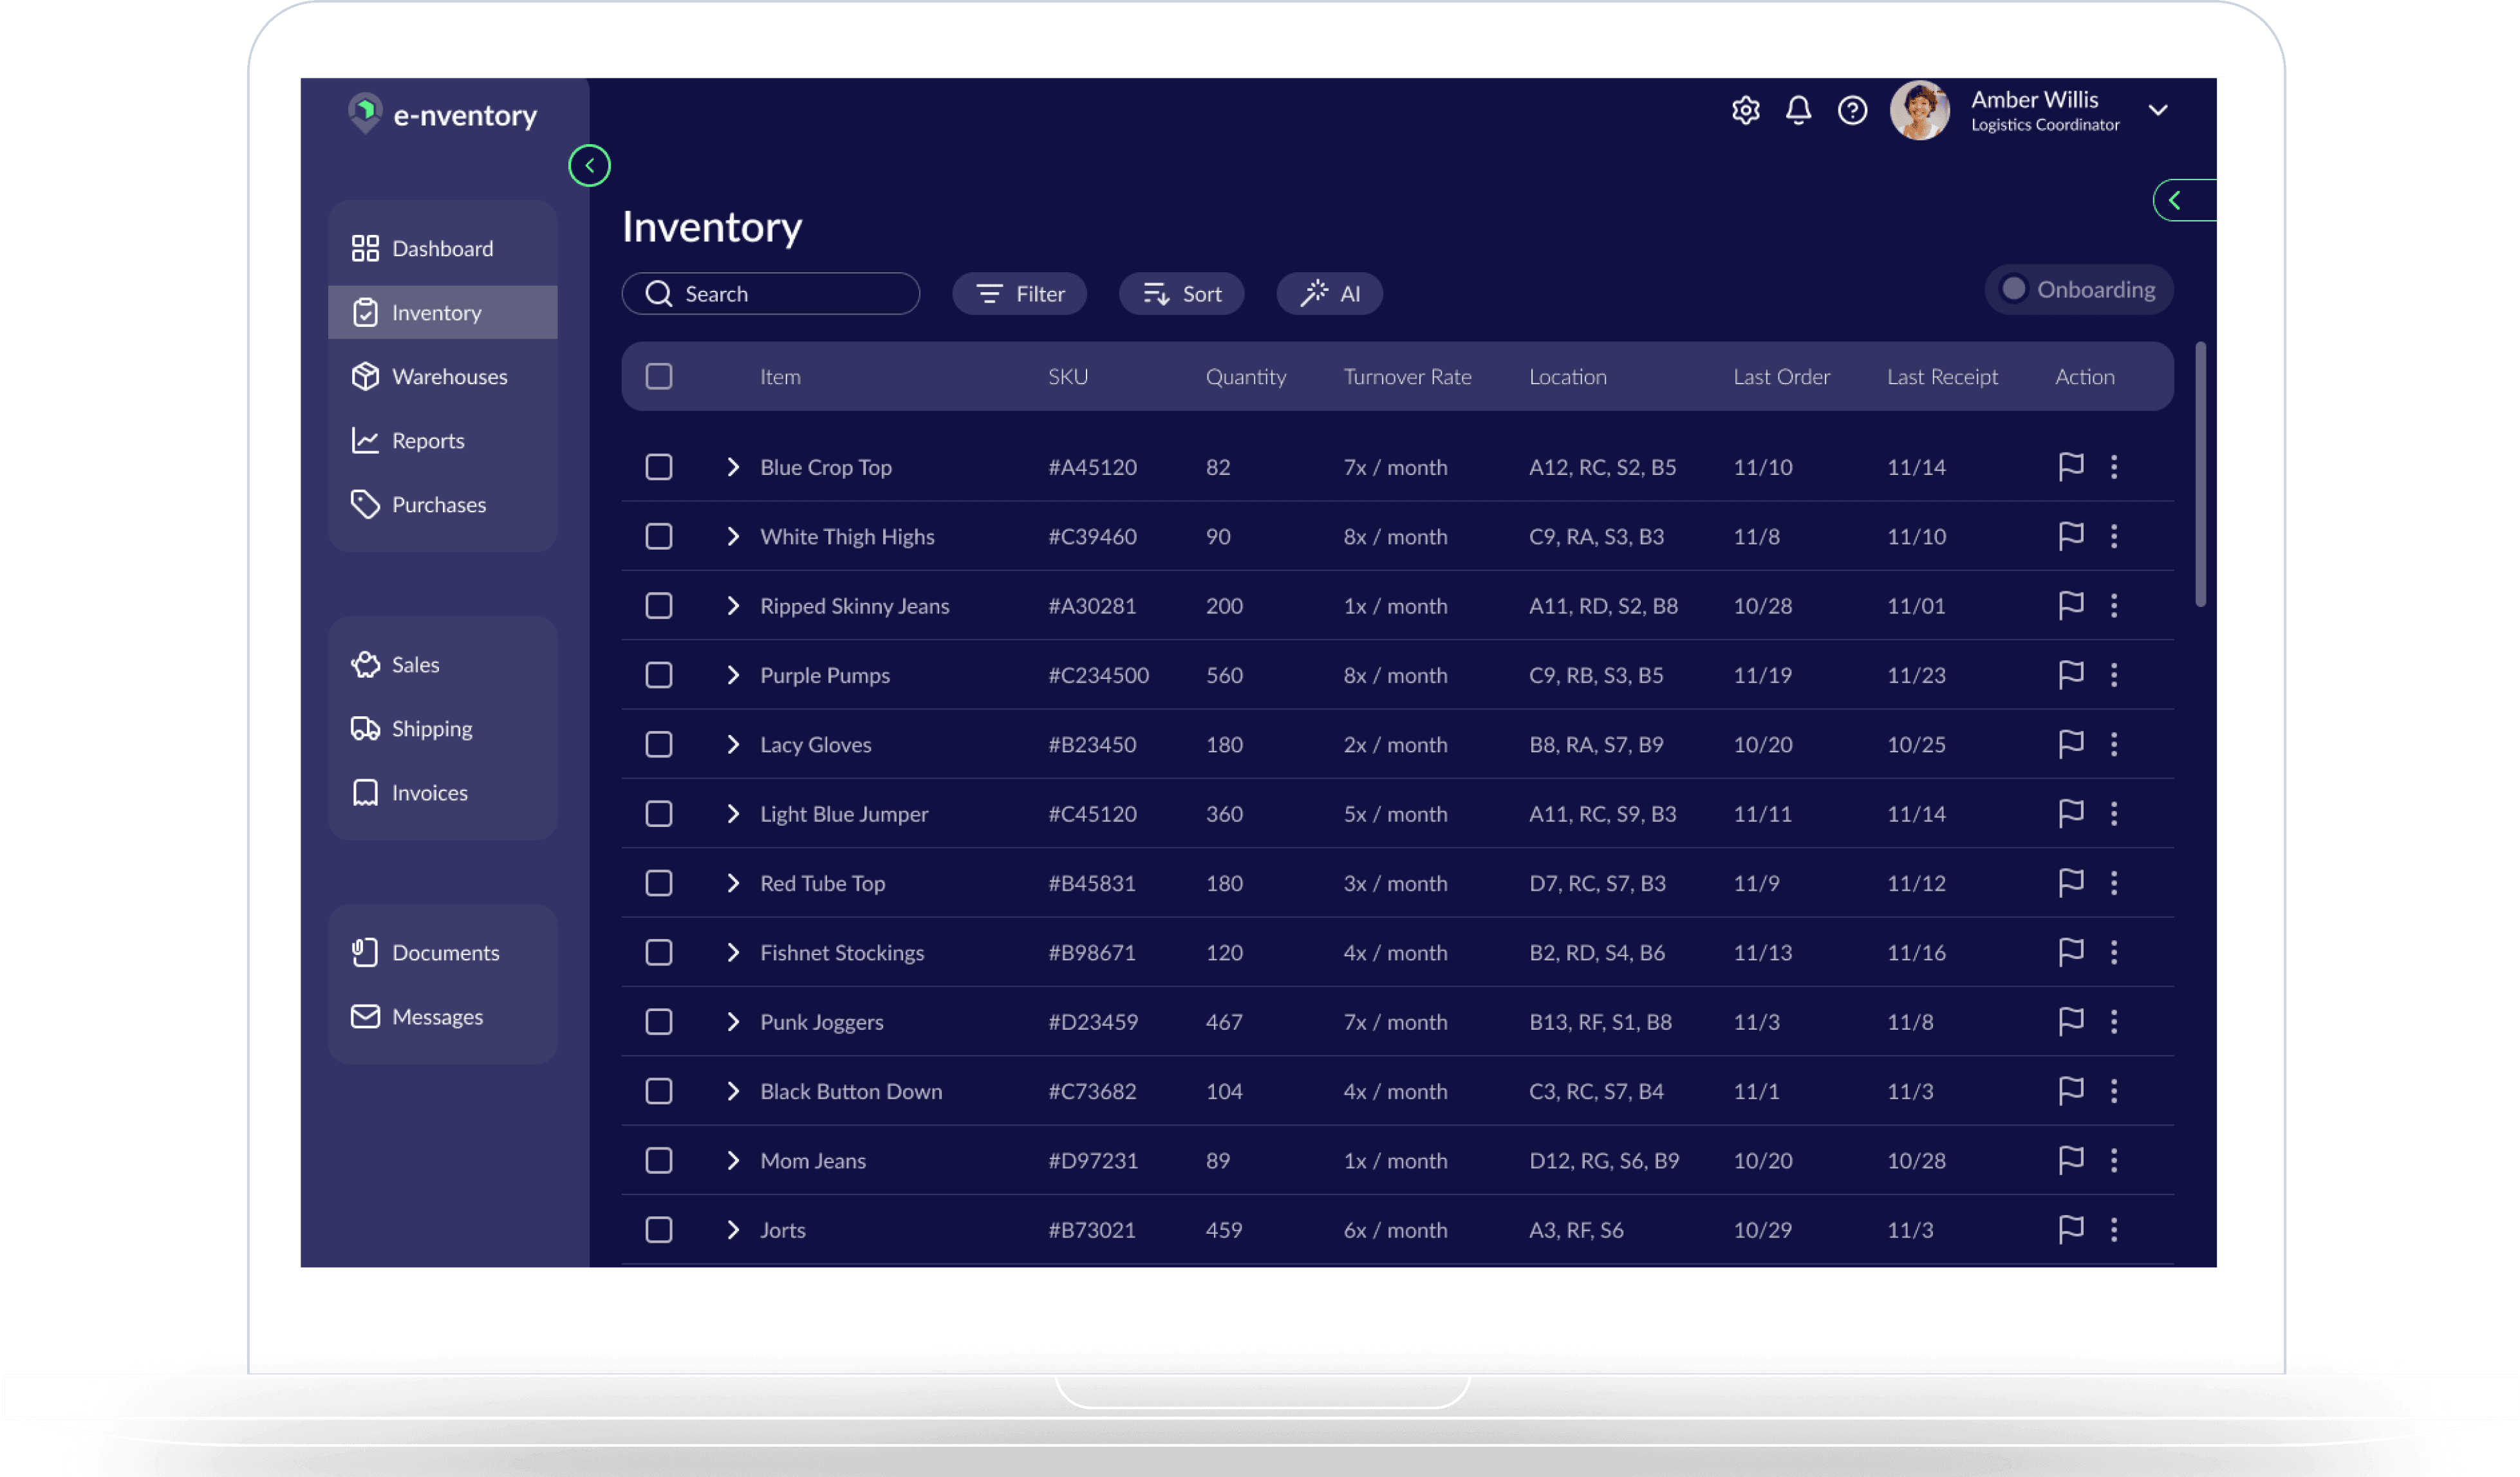
Table Simplification: Combined 'Requisitions' and 'Recent Orders' into a single 'Order Activity' table for a clearer overview.
Data Ink Ratio: Simplified the bar chart and removed redundant data to highlight Store Inventory Stock.
Before and After Comparison
Below is the comparison of the changes from before and after the UX/UI updates on the main dashboard. The left side is the old version and the right side is the updated layout. The right side has an enhanced hierarchy and solutions that seamlessly go with the existing format.
Before
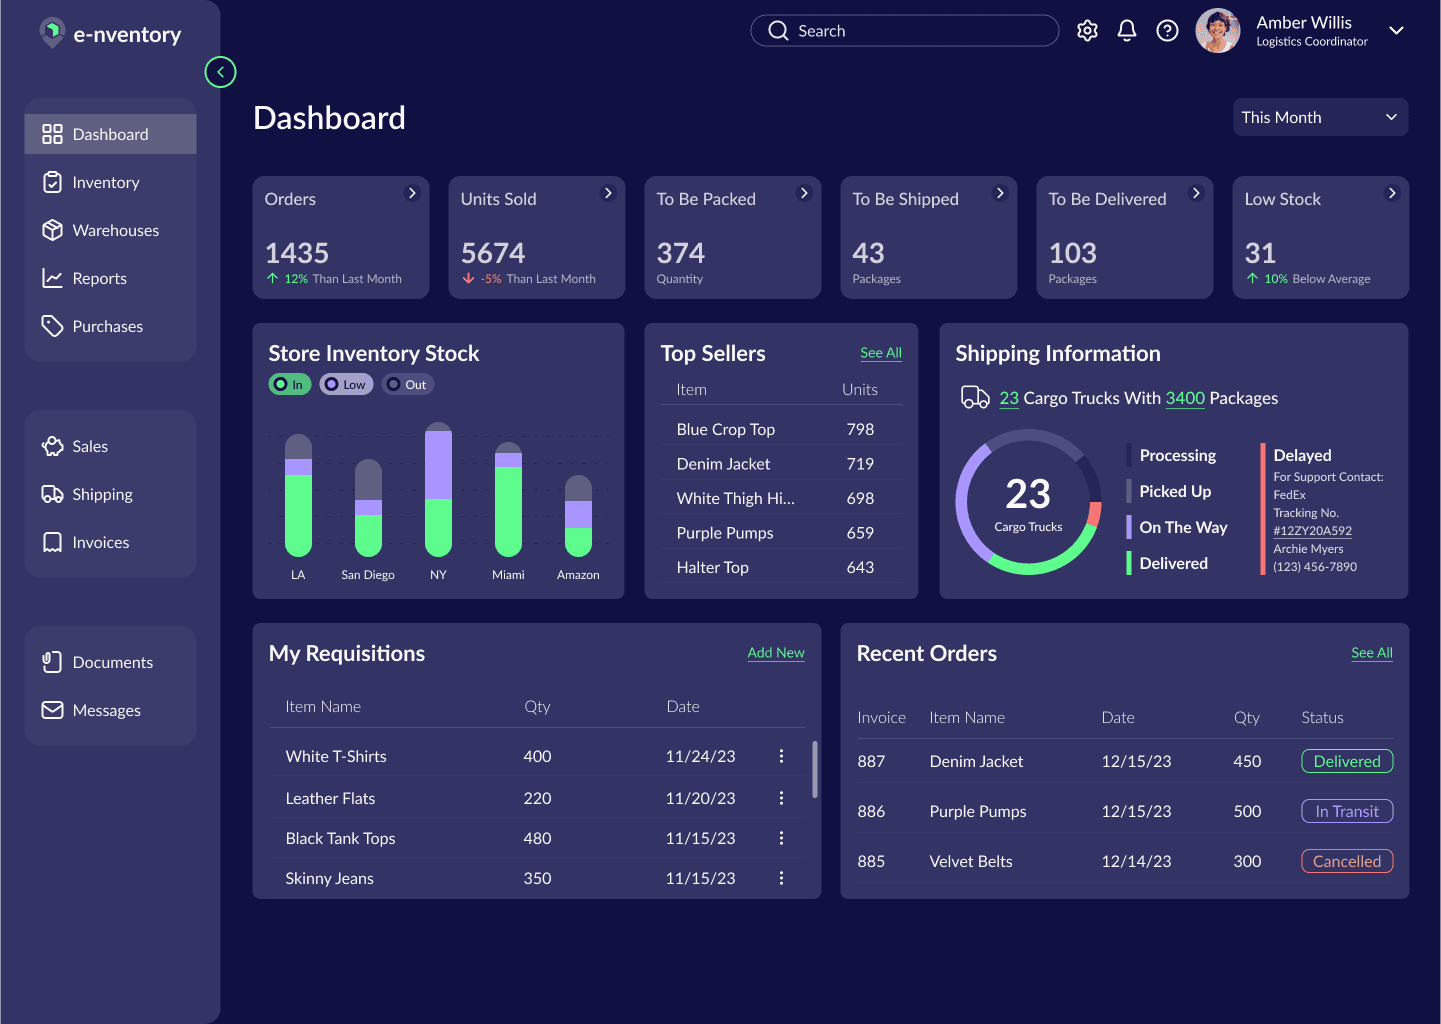
After

Final Design


5
Reflection
Reflecting on the UX case study for e-nventory, user-centered design is crucial for developing effective software solutions. The project began with thorough user research, including interviews and the creation of personas, which highlighted the diverse needs of novice and experienced users. This research informed the design process, leading to features like onboarding buttons and detailed information popovers to support new users, and predictive tools for experienced users. The iterative design approach, using methods such as Crazy 8's and hierarchical structuring of information, ensured that the final dashboard was both innovative and practical, addressing common pain points and improving usability. The case study underscores the transformative power of UX design in enhancing user experiences and operational efficiency in complex applications.
